Log into your Charles Schwab account.

https://www.schwab.com/client-home
How to find good dividend stocks to invest in?
When you log into your Schwab account, you will land on the Summary page.
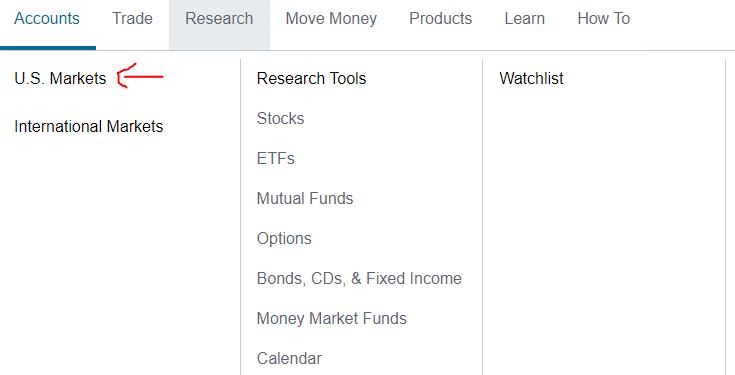
From the top bar, click or hoover on Research and click on US Markets.
Depending on your account you might have to click on Classic View if you are given the choice.

How to access market sectors in the current view?
After you logged into your Charles Schwab account, click on Research in the top bar. Click on US market in the drop-down menu. Instead of clicking on classic view, scroll down to the bottom to the sectors section.
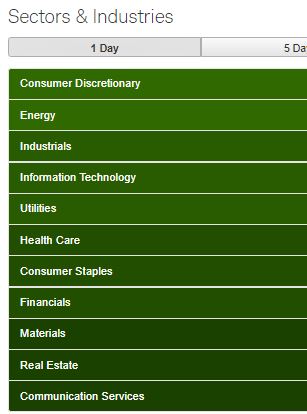

Right underneath the sectors, click on “disclose more”. You will see the market sectors list.
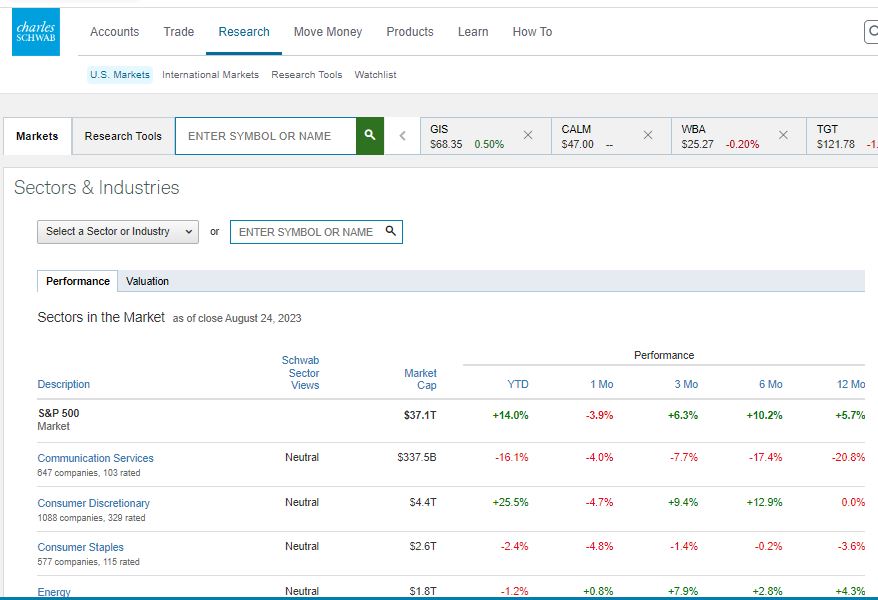

Click on Industries.
You will have the sectors and industries list open.
Scroll down to see the list.
You will see the list of sectors.
Have your investment spreadsheet open and record the list of the different sectors if you do not have it yet.
Click on the 1st sector or a sector of choice.
Record the industries in that sector in your stock worksheet.
Click on the 1st industry or an industry of choice.
Record sub industries in your workbook.
Click on one sub industry.
You will have a list of companies’ stocks.
How to access market sectors in the classic view?

After you logged into your Charles Schwab account, click on Research in the top bar. Click on US market in the drop-down menu. Click on classic view at the right corner of the page.
Click on Industries.

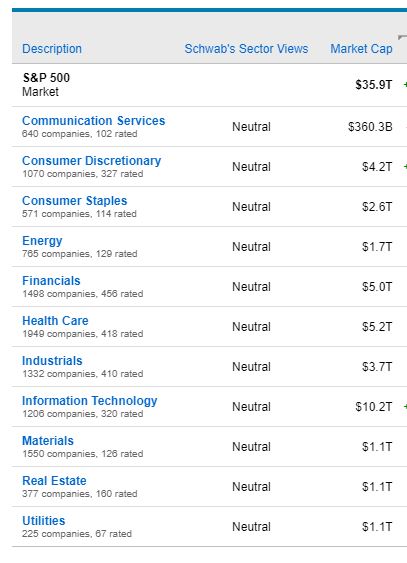
You will see the list of sectors.
Have your investment spreadsheet open and record the list of the different sectors if you do not have it yet.
Click on the 1st sector or a sector of choice.
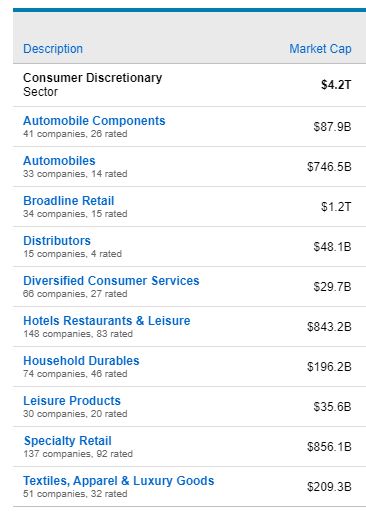
Record the industries in that sector in your stock worksheet.
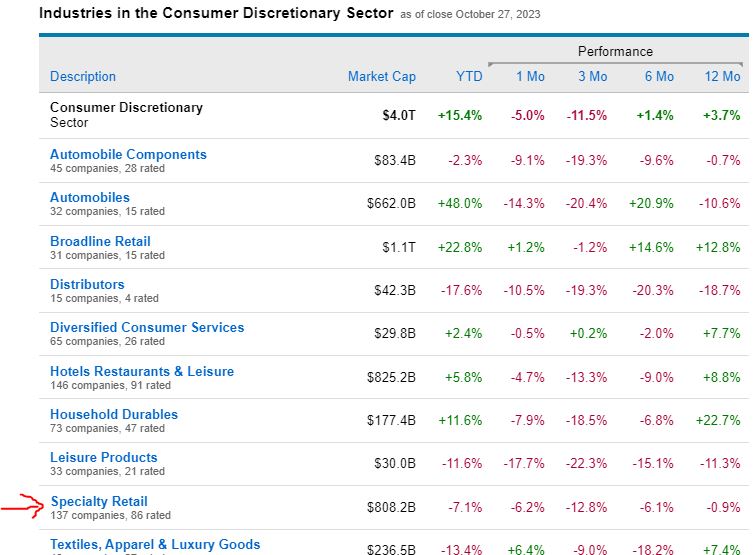
Click on the 1st industry or an industry of choice.
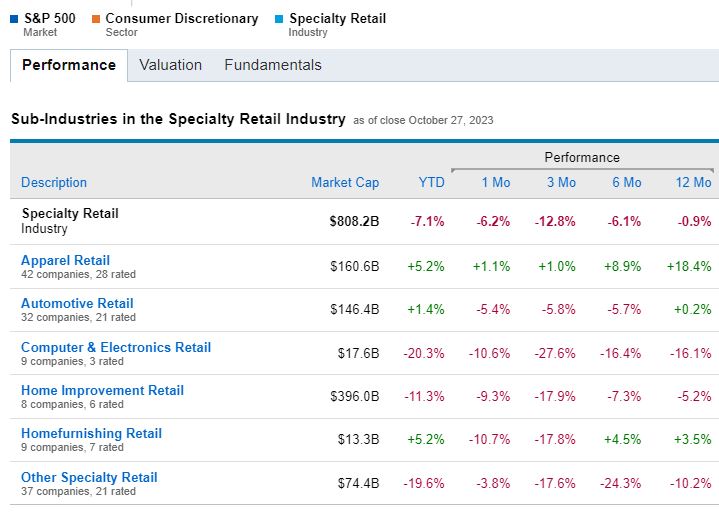
Record sub industries in your workbook.
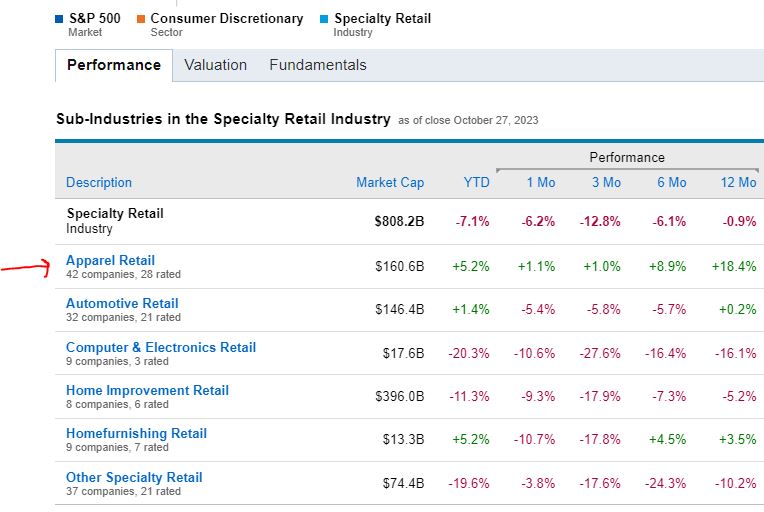
Click on one sub industry.
You will have a list of companies’ stocks.
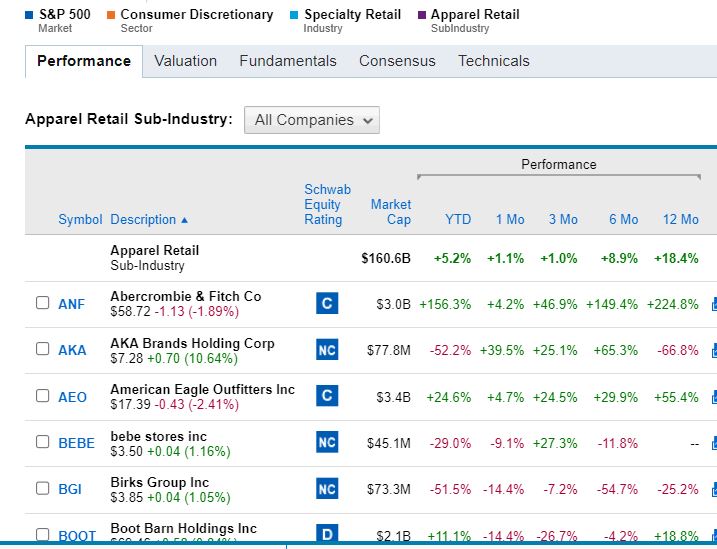
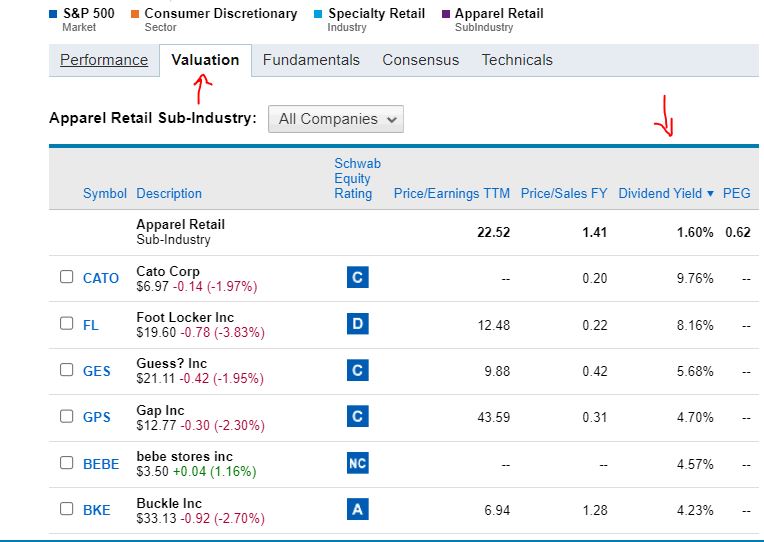

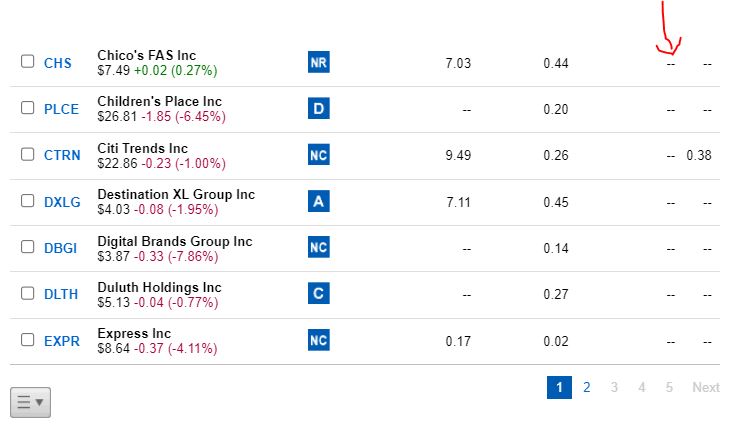
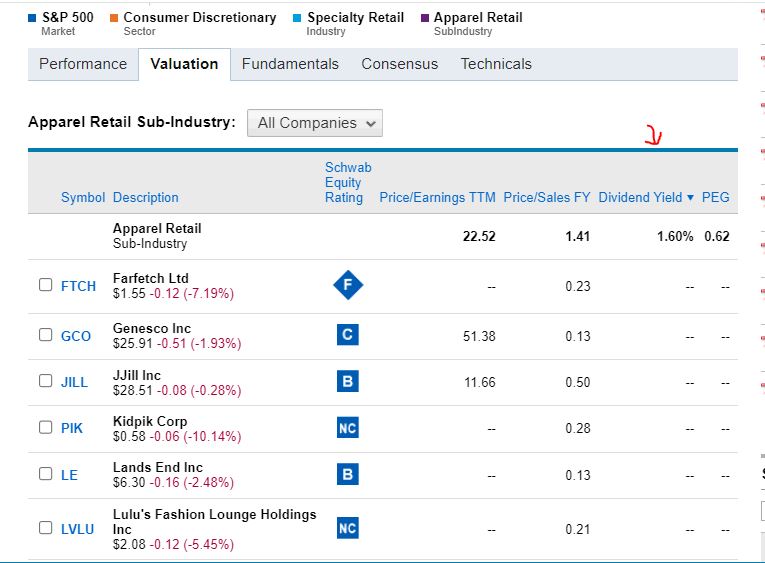
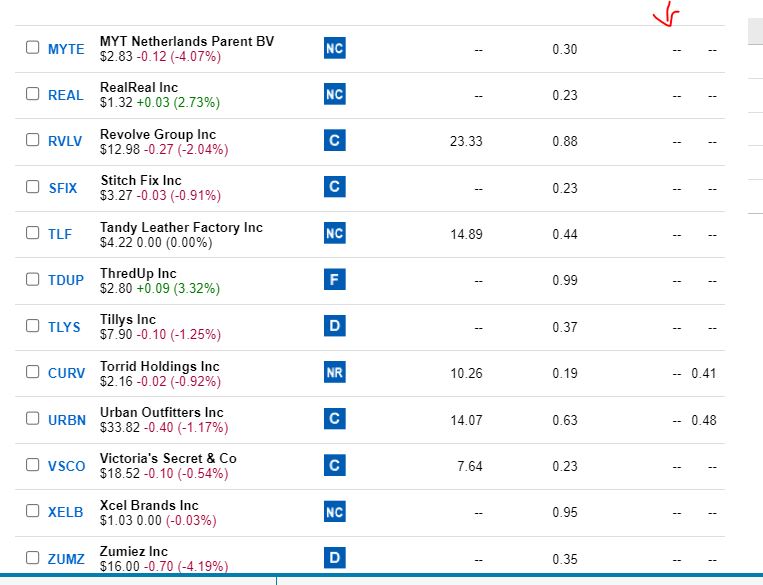
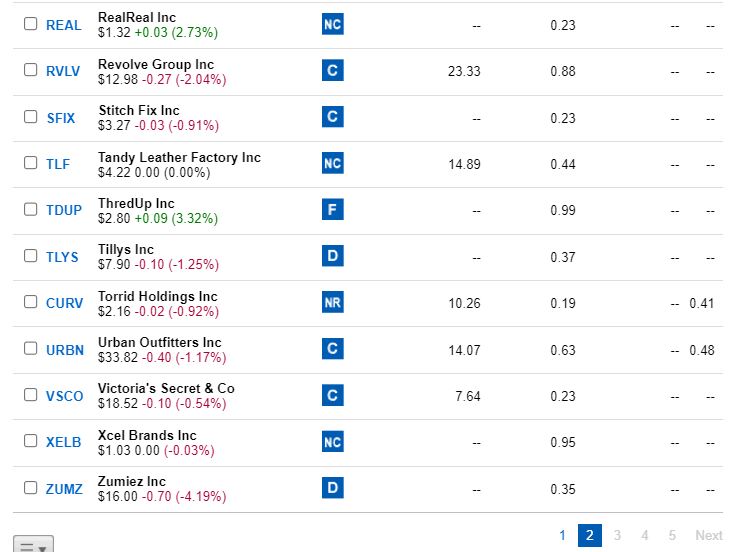
Filter One: Dividend rate
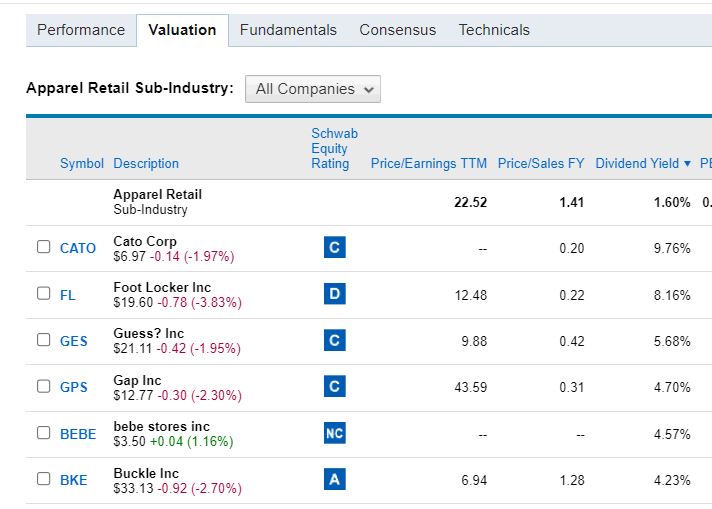
Sort the stocks by annual dividend rate.
Our goal is to filter stocks that offer dividends.
Click on valuation on top of the stocks.

The new filters will include Dividends.
Click on Dividends.
That will filter the stocks from high dividends to low dividends.
Look at the stock names of the dividends you judge high enough for you.
Filter 2: Eliminate LLC and partnership companies.
LLC and partnership companies pay high dividends but sent out Schedule K-1 to investors in spring that you will use to file your 1040 if you invest in an LLC stock in your brokerage account.
If you invest in an LLC stock in your Roth IRA, the brokerage firm will file a form 990-T (Exempt Organization Business Income Tax Return) on your behalf in spring. You will receive the Schedule K-1 from the company and send it to your brokerage firm for them to file a tax return on your behalf related to that Schedule K-1.
I would not advise you to invest in partnership or LLC stocks. They are a hassle.
If the company’s name of a high dividend stock ends with partnership, LP, Ltd, Limited, or LLC, discard it.
If a company ends with Inc., Corp, Corporation, or Co., it is a corporation. Look at the dividend to see if it is high and meets the dividend rate standard you set. The dividend rate on that page is an annual dividend rate.
If yes, record that company’s name, its symbol, its stock price, as well as its annual dividend rate in your investment workbook.
Continue to the next company.
Filter 3: Avoid most international companies.
You may not know if they are limited companies or corporations. Therefore, you can avoid most of them unless you like them or unless it is a corporation. Most of them will have SA at the end of the company’s name. SA is not a US entity classification. Therefore, I am not sure if both a limited company and a corporation could use that same entity title.
Batch Research Dividend Stocks
When you are done scrutinizing companies in a sub industry, and record the name of the corporate companies’ stocks that pay high dividends, in your investment worksheet, go to the top of the page and click on the name of the industry you are in.
You will go back to the list of sub industries inside that industry. You can click on the next sub industry and analyze its companies.
Once you see the list of companies in that sub industry, click on valuation to filter with dividends.
Repeat the process on top to locate high dividends stocks that are not partnership companies or SA international companies.
You can continue the process and record all the high dividend stocks in all sub industries in all industries in one sector of the stock market for your own stock investment spreadsheet.
After you have your list of stocks from a market sector, you can proceed to filter them down again.
How to record stocks in your investment spreadsheet?
Draft a spreadsheet.

Have a column for the stock company name.
Have a column for the stock symbol.
Have a column for each one of the following:
Market the stock is sold on.
Current price
52 Weeks low price
52 weeks high price
Dividend rate
Chart trend
Sector
Industry
Sub industry
Year it went public.
That will be the spreadsheet tab you will record your corporate high paying dividends stocks.
When you filter stocks by dividends, you record the company name, the symbol, the current price, and the annual dividend rate in your spreadsheet.
You will complete the rest of your analysis as you continue to apply more filters to the companies that made it to your spreadsheet.
Filter 4: Remove OCT market stocks.

Once you have a list of a market sector’s companies that made to your stock investment spreadsheet, you can analyze them further to mark the good ones.
If you use Charles Schwab, login in your Charles Schwab account.
Click on Research in the top bar.
Click on Stocks in the drop-down window.
Type a company symbol from your workbook in the search box.
Click research or click on the name of the company associated with the symbol in the suggested window.
You will access the stock summary page where you can retrieve some financial data.
Record the market the company stock is sold on.
Discard OTC over the counter market stocks.
Penny stocks are sold on OTC market.
Some international companies’ stocks are sold on OTC.
Penny stocks can fluctuate a lot. They might be good to speculate on but risky to invest in the long term. Therefore, you might avoid them.
You don’t need to remove them from your list.
If the market the stock is sold on is OTC, you can just stop there for that stock. It didn’t pass your requirement.
Just move to the next company.
Type another symbol in the symbol search bar right above the company name of the stock you just searched.
Look at the market the stock is sold on.
You want stocks sold on market exchange like NYSE and NADSAQ.
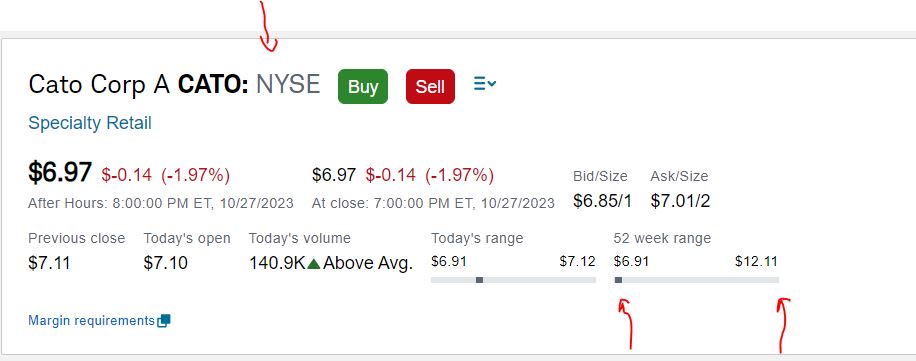
When the company stock is sold on NYSE or NASDAQ, record the 52 weeks low and high. That is the lowest price and the highest price the stock sold during the past 52 weeks.
Scroll down and double check the annual dividend yield.
Check the month in the quarter the dividend is paid and record it in your stock worksheet.
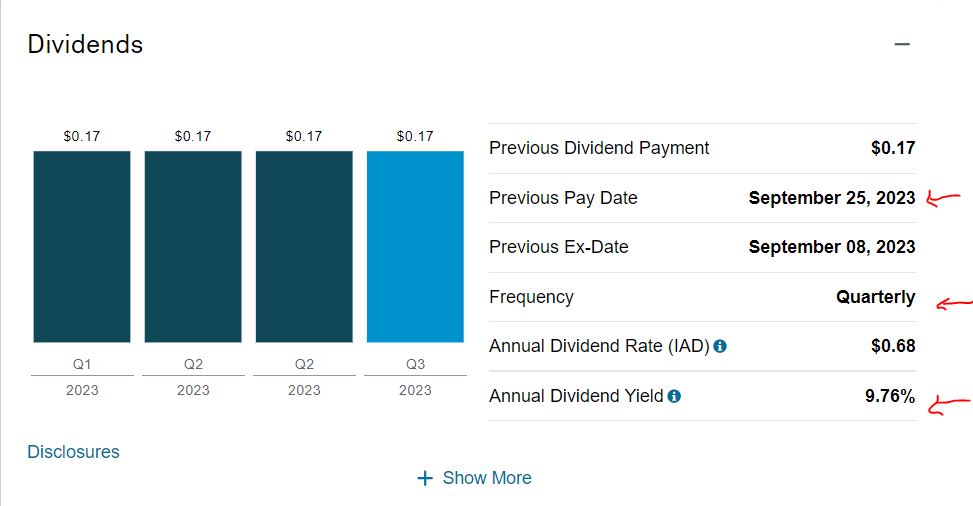
The stock passed this filter. Move to the next filter.
Filter 5: Avoid new companies.
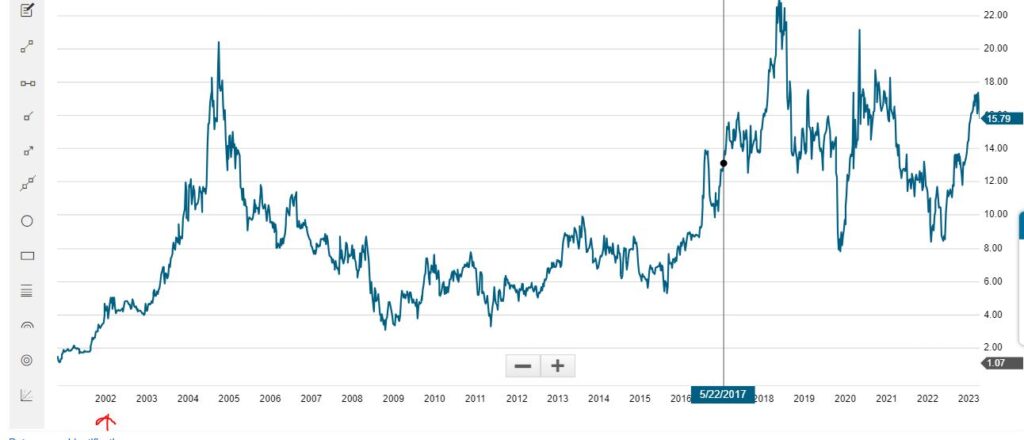
Scroll down to the chart.
Click on more details on top of the chart at the right.
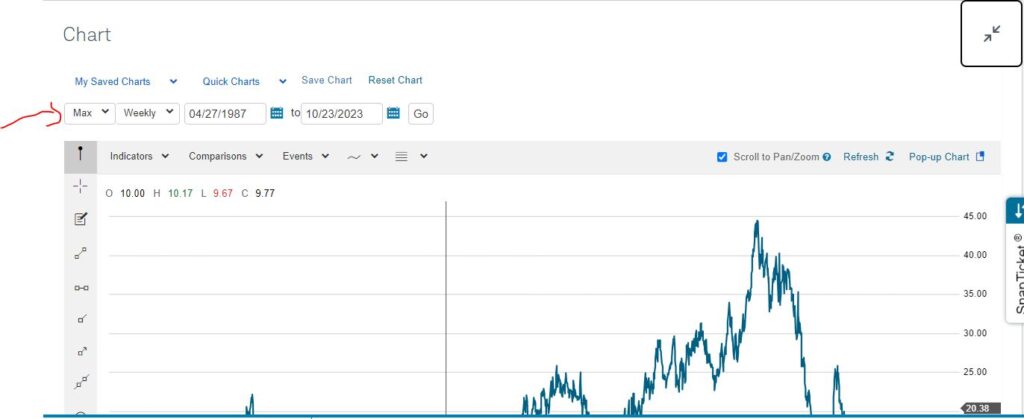
Make sure it is “Max” chart. Otherwise, click on the period to choose “Max” in the drop-down menu.
You will see the chart far back to when the company went public.
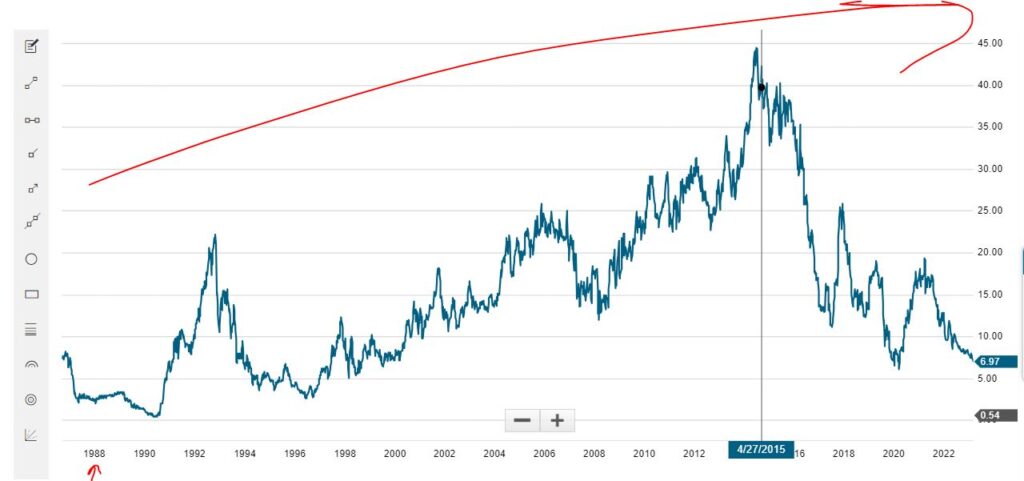
Record the oldest year on the chart in your workbook.
Avoid new companies.
You can set a year as benchmark not to buy stock that went public after that year.
If the stock went public before the year you set, the stock passed this filter. You move to the next filter.
Filter 5: Chart Analysis
Look at the chart and record the trend.
Is the trend upward? Does the chart reflect growth and dip? Is the chart level through the years? Is the chart downward when you see the start of the chart and its end?
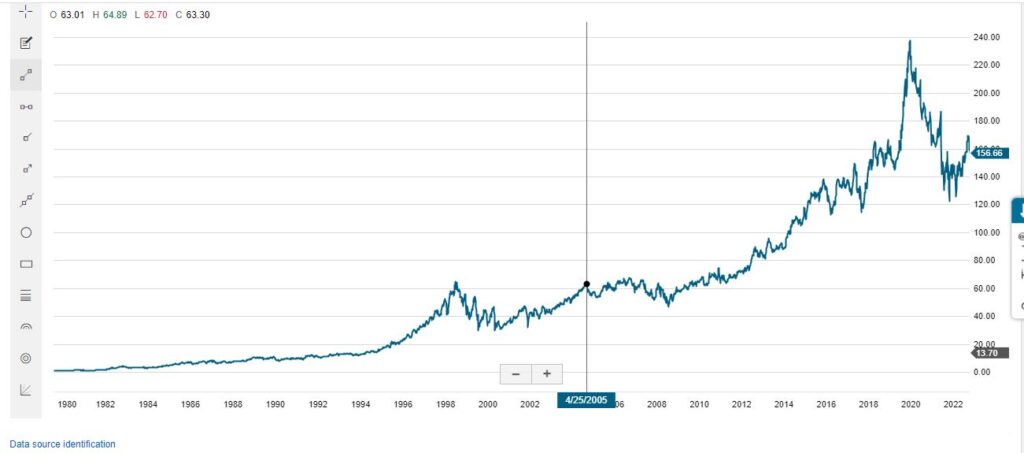
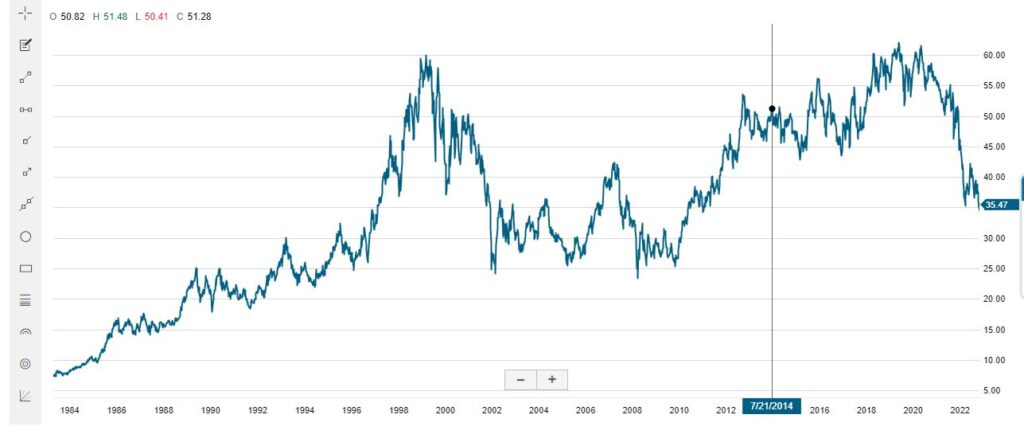
Note your chart remark in your workbook.
If the chart is upward, and the company went public decades ago, highlight the row for that company and make a note next to it that you could buy it if you like the annual dividend rate it pays.
That is a company you could invest in with the assumption that while you have that stock in your portfolio it will continue to generate dividends for you and continue to appreciate year after year.
You will buy it when the price is low and close to 52 weeks low than it is to its 52 weeks high.
Investing in dividends stock is to generate streams of income through stock investment without selling the stocks.
You don’t need to wait for the stocks to appreciate overtime for you to sell to realize gain. You want to generate a stream of income overtime from your dividends to replace your income from your jobs without the need of selling your stocks. In case of economic crisis, you will not worry about selling your stocks at a loss to access your funds. They will continue to generate a stream of income through dividends.
You can continue this stock evaluation process to bulk evaluate the stocks in the sector you recorded in your spreadsheet. You highlight the ones that are good for you to invest in.
The goal is to invest in high paying dividend corporations’ stocks that have been around for many decades and show an upward chart growth. You buy some shares of a company’s stock that meet these requirements when its stock price is low and close to 52 weeks low.
After you invested in all the upward growth companies that you bookmarked, you can stream some high paying dividends corporations’ stocks that have been around for many decades that show growth and dip trend in their chart. You purchase their shares when their stock prices are low close to their 52 weeks low.
Keep an eye on the sectors you invested in and make sure you invest in many of them to stay diversified.
When can you buy stock?
Login into your Charles Schwab account.
Click on Search in the top bar.
Click on Stocks in the sub menus.
Search for one of the stocks you highlighted in your list.
Type the stock symbol in the symbol search box.
That stock summary page will open.
Look at the current price and compare it to the 52-week low and high.
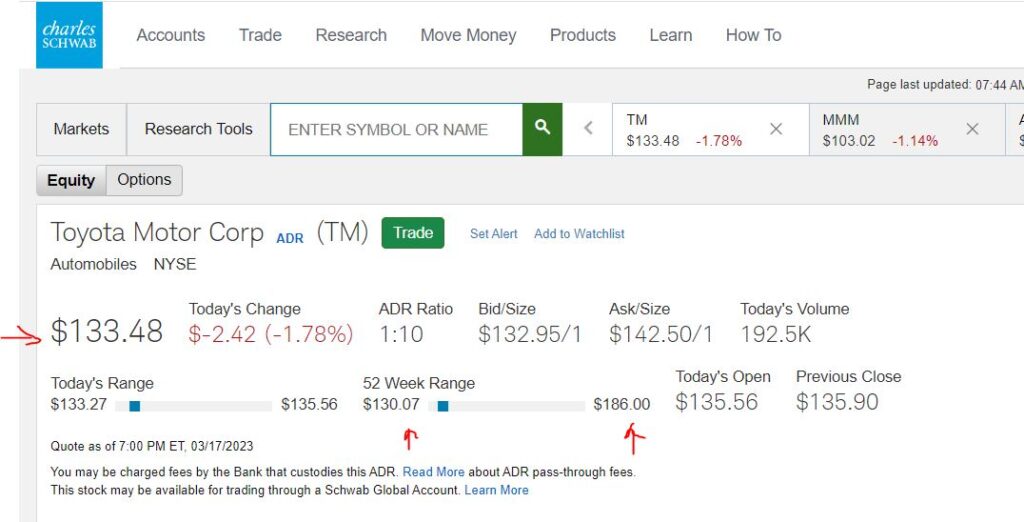
If the current price is close to its 52-week low, place the order and set a “Limit price” little lower price you want to buy it at. Choose the number of shares you want to purchase. Set the purchase order “Good until date”. Make sure you selected the right investment account you want you purchase the stock in if you have more than one account. If the stock price goes that low within that time frame, the brokerage firm will buy it for you.
Make note in your investment worksheet for stocks you purchased and stocks you placed an order for. That way you make sure you have enough cash in the account for the purchase orders to go through when the stocks go low and reach your limit price.
Your investment account will show the cash you have available but will not take into consideration stocks you placed orders for. Therefore, maintaining an investment spreadsheet to track amount your deposited in your investment account, the amount you spent in stocks, and the amount committed to stock purchase will allow you to estimate the amount you have remaining to invest without over committing or overspending when all your purchase orders go through.
Brokerage account vs Roth IRA account vs IRA account
If you want to create a stream of income through dividend stock investment, you could invest in a brokerage account instead of a Roth IRA or an IRA account.
A brokerage account is taxable. You should report the dividend income you earned on your Form 1040. It is taxable even if you reinvest the dividends.
If you sell stocks in your brokerage account for profit or loss, you report it on your Form 1040 Individual tax return.
Roth IRA has a limit you can invest generally around $6,000 or $7,500 a year based on the age. The government set the maximum to invest every year.
But the government sets a time frame when you can withdraw from that account. Your earnings within your Roth are tax free unless you invest in LLC companies’ stocks. If you invested in LLC companies in your Roth, your brokerage firm will file a tax return for your Roth for these LLC stocks. You will receive Schedule K-1s from these LLCs and you mail them to your brokerage firm at their request and they will file them for you. You invest after tax money in your Roth IRA. The profit you generate from these investments is tax free when you withdraw them at the right age set by the government.
An IRA is taxable when you withdraw from it. You invest before tax money in it. At the age set by the government and the minimum required to withdraw a year, you pay taxes on the full amount you withdraw including your principal. The maximum amount to invest in a year varies between $6,500 to $7,000 based on the age and is set by the government.
Retirement accounts are not quite designed for you to build a stream of income in them. They are built for you to withdraw from to $0.
If you are creating a stream of income through dividend stock investment that you can access when you want it without the government telling you when you can or at what minimum age you can access it or the minimum you are required to withdraw or how much maximum you can invest a year, a brokerage account might be the right account. Whether the stock market is down or not, you don’t need to sell a stock when you can live on their dividend income. Just keep in mind that the income you generate in the brokerage account is taxable just like income from your job.
You can choose at any time not to reinvest the dividends and use the dividends as source of income, in case of a temporary job loss, or to pay kids college education, or to pay for a travel, or pay for a house repair like siding, or roofing.
If you purchased an appliance for your house, estimate its last expectancy. It is a good idea to keep a record of this house’s long-term expenses to know when a replacement date is approaching to start budgeting for it.
Then determine how much you should invest in a company’s stocks and what dividend to generate a dividend income equal to the cost of the appliance within the time frame. That way you know next time the appliance breaks, you have a company paying you enough dividend to replace that appliance.
For instance, if you purchase a stove for $250 and estimate it will last 5 years.
What company will pay you 6% and how much should you invest in that company that pays 6% annual dividend to earn $250 every 5 years to replace your stove? $250/0.06=$4,167 should be invested in that company’s stock. If you want to invest that money in 5 years, that will be $833 to invest a year or $69.45 a month.
To create a stream of income, how much should you invest in dividend stocks?
How much to invest in dividend stock?
To create a stream of income, you can set an investment routine your finances can handle, and you can do for a long time. The result might be slow, but it will compound over time.
Set a minimum annual dividend income.
You can choose to make $1,000 dividends a year. To make $1,000 dividends a year, what annual dividends rate you like to set as a benchmark?
Set average annual dividend rate.
If you set 6%, how much should you invest a year to earn $1,000 in dividend at 6% a year?
Determine the minimum amount to invest in a year.
You take the dividend income set / dividend rate you like to find the minimum amount to invest a year.
You need to invest at least $16,667 a year in a stock or multiple stocks that pay at least 6% annual dividend rate to generate $1,000 a year. Keep in mind that as you reinvest the dividend back in the stocks, the dividend will generate dividends, compounding your investment. But for simplicity purposes we just focus on your out-of-pocket investments or your capital.
Calculate the monthly amount to invest.
Now that you know how much you should invest a year, you need to know how much you should invest a month and keep a routine of?
You take your annual investment amount /12. In the example above, that is $16,667/12= $1,388 to invest a month.
If you invest $1,388 a month and earn around $1,000 a year in dividend which you reinvest, if you set 10 years’ time frame goal, what you make in annual dividend, you will make it in a monthly basis after these 10 years of investment. That means after 10 years, you could generate about $1,000 in dividend income a month using the investment example above.
You can start with the amount of dividend income you want to generate a month after 10 years and use that amount as dividend amount to generate in a year now to back into how much to invest a month to generate that dividend a year. If you can generate that dividend a year, you can generate it and more monthly after 10 years.
If a $1,000 annual dividend sounds great but $1,388 amount to invest a month is not in your budget right now, you can start with a $500 annual dividend to see how much you need to invest.
To earn $500 a year in dividend at 6% a year, $500/0.06=$8,333.33 to invest a year.
$8,333.33/12=$694 amount to invest a month.
Determine the monthly amount to invest based on your living expenses.

To create a stream of income from dividend stock to cover your living expenses, you need to know your basic living expenses. You can set 10 years to reach that goal.
You need to estimate your living expenses without debt.

If we assume your basic living expenses can be budgeted at $1,000 a month plus another $1,000 a month for irregular expenses to save for including holiday gifts, home maintenance, car repair, home and car insurances, home property tax, birthday gifts, travel, entertainment, doctor copay, medicine purchases, kids school registration fees, kids back to school supplies costs, kids clothing, home appliance cost, … To estimate how much to save for irregular expenses, you estimate how much each one of these irregular expense categories can cost you a year. Then you divide the total by 12 to find the amount to save a month. In this example let’s assume that is $12, 000 a year for living expenses and $12,000 a year for irregular expenses to keep in your saving to cover these expenses if or when they incur. That is a total of $24,000 a year no mortgage, rent, tuition loan, or credit card debts included. When you pay off your debts, and are frugal, you do not need a lot of money for your living expenses.
You can download for free a “Budget and Monthly Expense Spreadsheet” under our Free Downloads.
At 6% dividend rates from stocks, you need to invest $400,000 ($24,000/0.06) or $200,000 ($12,000/0.06) to generate $24,000 a year in dividend income or $12,000 a year in dividend income if you invested in stocks that pay you around 6% annual dividend rate without even taking into consideration stock appreciation over time. And assuming you do not need to sell the stocks. You just live on the dividends they generate.
If you set a 10 years’ time frame to reach that goal, that is $40,000 ($400,000/10) or $20,000 ($200,000/10) a year to invest.
By month that is $3,333.33 ($40,000/12) or $1,666.67 ($20,000/12) to invest.
Set monthly amount to invest based on specific expense.
You can also approach investment at the micro level.
If you spend $50 a month on your cell phone, that is $600 a year.
How much should you invest in Verizon or AT&T for instance at 6% dividend rate a year for that dividend income to pay for your cell phone bill?
You take $600/0.06=$10,000.
You need to invest $10,000 in a 6% dividend stock to generate $600 every year.
If you set 10 years to reach that goal, that is $10,000/10 and is $1,000 to invest a year. That is $83.33 a month to invest.
You can also break down your living expenses into expense category and plan on investing enough a year to generate dividend income to cover that expense category. And every year you choose another expense category to invest enough for the dividend income to cover that expense category.
Alternatively, like discussed above, you can do it at the macro level when you use your total living expenses and do the calculation to come down to how much to invest a month to reach that dividend income stream goal within a certain number of years you set.
How many dividend stocks do you have in your portfolio?
The choice is yours. If you invest in single stocks, you might have to invest in many companies’ stocks across industries and sectors.
You should have a stock spreadsheet to record the stocks you are interested in.
Once you invest in them, you can continue to reinvest in them when their prices go down. You don’t need to purchase a new stock you never owned before unless you want to.
You might make sure you purchase stock in every sector and possibly every industry.
Once you have about 100 different stocks in your portfolio you can see if you are able to manage them. Then you decide if you want to introduce more or keep reinvesting in the ones you have.
Track dividends paid by your stocks by month.
Diversify to generate dividend income every month.

Pull monthly stock history report to your investment spreadsheet.
Charles Schwab allows you to download a CSV form of your account history.
Take note of the month you do not earn a lot of dividends. Most stocks pay dividends by quarter.
If your dividend spreadsheet tracks dividends by month, you can compare the dividend you earned January, February, and March assuming you own these companies’ stocks during the first 3 months of the year. The companies that paid you dividends in January will most likely pay you in April. The ones that paid you in February will pay you in May. The March ones will pay you in June.
If you earn dividend income in January, February, and March or every month of a quarter, chances are you will earn dividend income every month of the year.
If any month in the first 3 months has a low dividend income, you can see stocks you own in your portfolio that paid you that month and decide to invest more in these companies when their stock prices are low. Or if these companies don’t pay a high dividend, you can look in your investment spreadsheet for stocks that you want to invest in and select the ones whose prices are low. Then filter them based on the month of the quarter they last paid dividend or the next pay dividend month and use that factor to narrow down the stocks to purchase.
You can diversify like that as well to ensure every month you generate income from dividends.
How to access your investment account history on Charles Schwab?
Your account history allows you to see the different transactions that occurred inside your account during a time frame including amount transferred, stock purchased, stocks sold, dividends paid, dividends reinvested, bank interest earned…
Login to your Charles Schwab account.
Click on Account in the top bar.
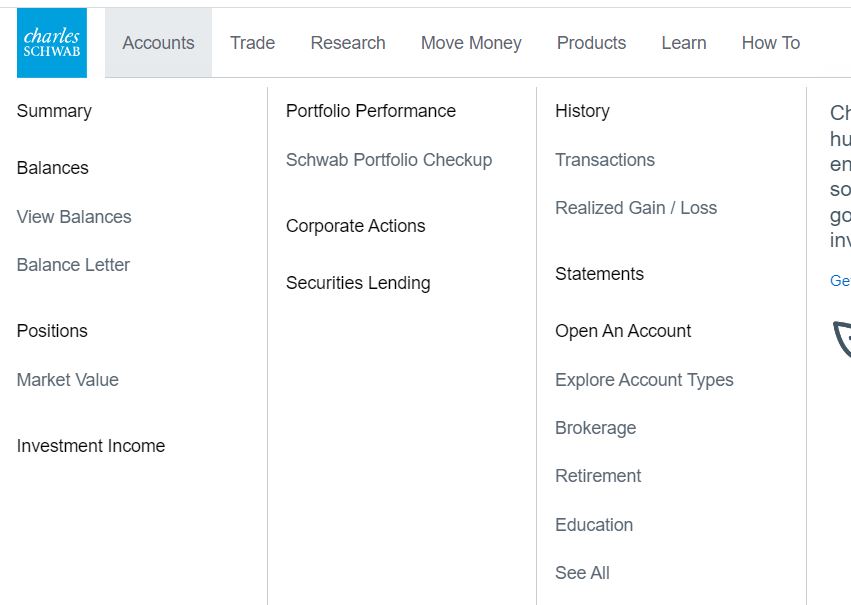
In the drop-down menu, click on “History”.

Make sure you are in the right account or select the account you want to check the history.

You can select a specific time frame or leave the default.
Scroll down to see the different transactions that affected that count number including stock purchased, amount invested, dividend paid, dividend reinvested, stock sold…
You can manually update your investment spreadsheet with data from the history page.
You could also export the data as CSV and paste it in your spreadsheet.
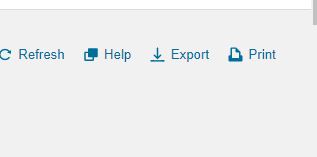
The export button is on top of the history page right before the print button.
How many shares for reinvested dividend to purchase at least 1 share of stock?
If a stock price is $10 and pays quarterly dividend of $0.25, you need 40 shares ($10/$0.25) for each dividend paid, to purchase 1 share of that stock.
Should you purchase many shares of one stock or purchase 1 share of many stocks?
I think you should try both ways and see which one you like better.
If you have a lot of money to invest, you can purchase many shares of one stock to the point that when dividend is paid out, it can purchase at least a share of that stock.
When you have little money to invest, you can search from your investment spreadsheet for the good stocks that are selling close to their 52 weeks low and purchase few shares of many stocks.
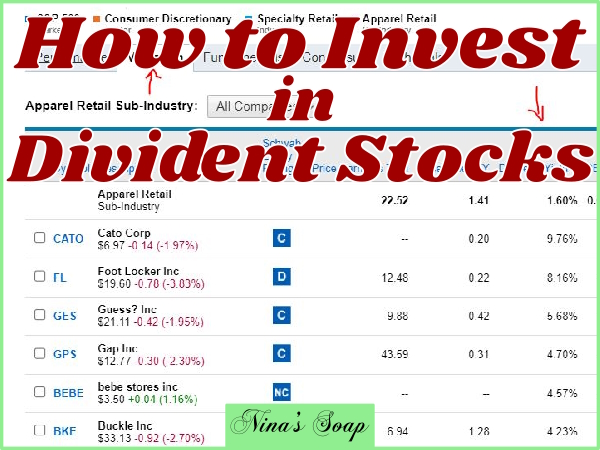
Conclusion: 7-How do I find Stocks that pay Dividends in the Specialty Retail Industry Apparel Retail Sub Industry?
The video explains how to find dividends stocks and analyze them to find the ones that meet your investment requirements.
In this video, we searched companies in the following sector and industry:
Sector:
Consumer Discretionary
Industry:
Specialty Retail
Sub Industries:
Apparel Retail
Resources
Related articles category:
Previous related articles:
Disclaimer:
“I am not an attorney to practice law. I am not allowed to draft legal documents, give advice on legal matters including immigration, or charge a fee for these activities.” Our contents are informative and based on our knowledge and experience. Use them at your own discretion.
Ads Disclaimer:
Ads are displayed in our contents. These ads do not influence the content we create and publish. We do not endorse them either.
Affiliate links Disclaimer:
Our Videos and articles contain affiliate links. When you click on them and make a purchase, we will receive a commission. We thank you very much for your support!
Our Vision
Nina’s Soap was created to help you live a healthy lifestyle within your budget while increasing your net worth.
Liberman Consulting L.L.C.’s contents are about different ways to save money, different ways to make money to reach your financial independence where you don’t worry about money or depend on your job to provide for your family.
Our Objectives
At Nina’s Soap (Liberman Consulting L.L.C.), you will find information about living a quality life within budget and increasing your net worth. Topics covered include personal finance, investment, business management, cooking from scratch, and growing some vegetables and fruit to save money and eat healthy.
“https://ninasoap.com/membership-join/ (We welcome you to join us. Email List)
care@ninasoap.com (contact info for any questions you may have)
https://ninasoap.com (blog), https://liberdownload.com (digital products), https://ninassoap.com (natural products), https://liberlabel.com (custom apparel), https://liberoutlet.com (resale store), https://www.youtube.com/c/LibermanConsultingLLC (YouTube Channel), https://www.pinterest.com/ninassoap/ (Pinterest), https://ninasoap.com/affiliate-products/ (Our resource page)”.
